blog competition

Help cities keep it fresh

Can you use the patterns, words, and phrases in Yelp reviews of restaurants to predict the number of hygeine violations that city health inspectors uncover?

Cities across the United States are capitalizing on big data. Predictive policing is becoming a prominent tool for public safety in many cities. In Boston, an algorithm helps determine “problem properties” where the city can target interventions. In Chicago, they are protecting citizens by predicting which landlords are not complying with city ordinances. In New York, the Fire Department sends inspectors to the highest risk buildings so they can prevent deadly fires from breaking out.

DrivenData is launching our first civic innovation competition, "Keeping it Fresh," to help cities capitalize on their data.

Average number of violations in Boston restaurants.

According to the Centers for Disease Control, more than 48 million Americans per year become sick from food, and an estimated 75% of the outbreaks came from food prepared by caterers, delis, and restaurants. In most cities, health inspections are generally random, which can increase time spent on spot checks at clean restaurants that have been following the rules closely — and missed opportunities to improve health and hygiene at places with more pressing food safety issues.

The goal for this competition is to use data from social media to narrow the search for health code violations in Boston. Competitors will have access to historical hygiene violation records from the City of Boston — a leader in open government data — and Yelp's consumer reviews. The challenge: Figure out the words, phrases, ratings, and patterns that predict violations, and help public health inspectors do their job better.

Winning algorithms will be awarded $5,000 in prizes: the first-place winner will receive $3,000, and two runners-up will receive $1,000 each. But the real prize is the opportunity to help the City of Boston, which is excited to explore ways to integrate the winning algorithm into its day-to-day inspection operations.


Early work on this problem has already indicated that consumers and citizens are leaving clues in their online restaurant reviews. A model from a Yelp internal hackathon tried to predict health scores in San Francisco restaurants. With a simple bag-of-words model, they were able to pick out trends in hygeine scores over time.


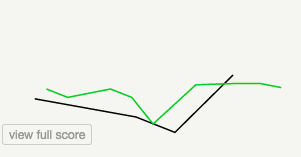
Predictions from Yelp model: Green is predicted, black is inspection results.

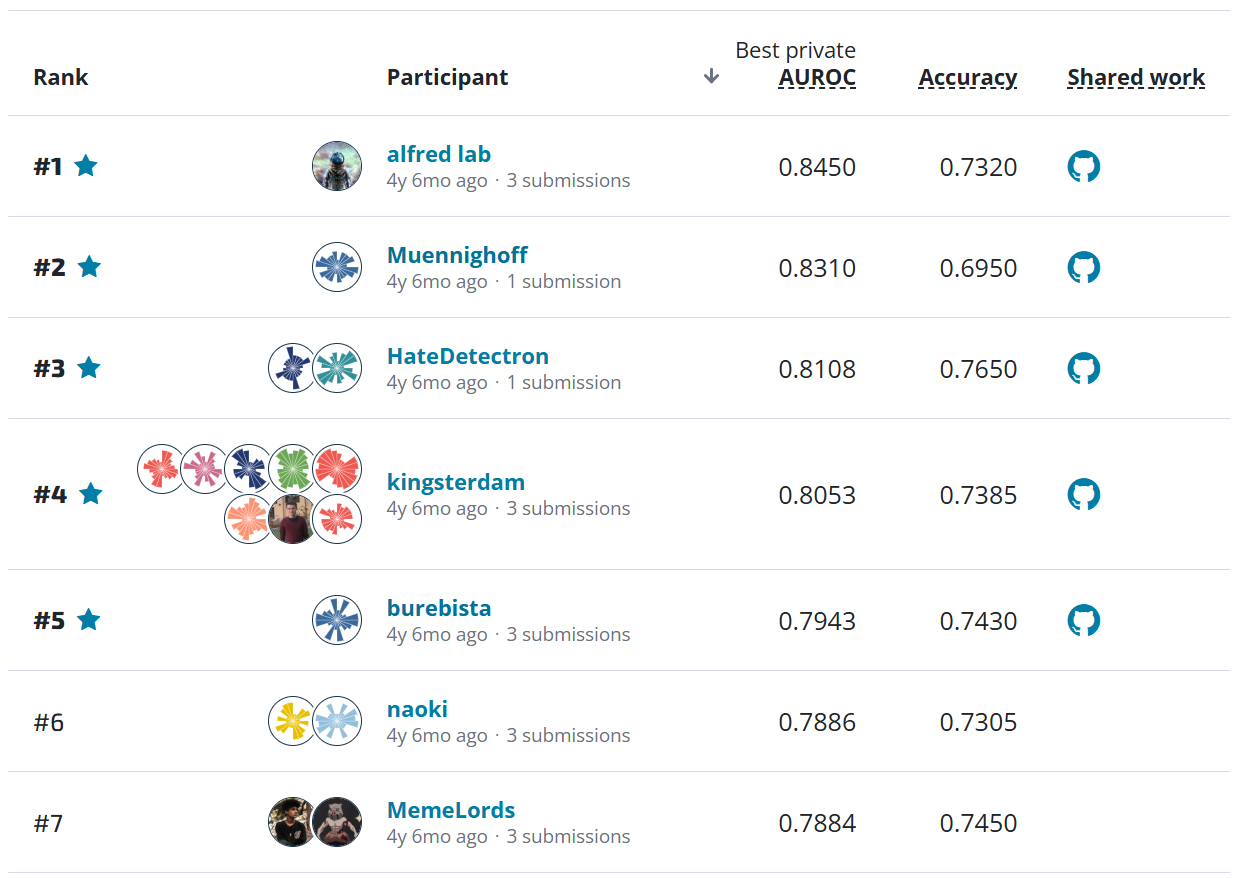
A reserach project using Yelp data for the City of Seattle had success picking out patterns that mattered as well. Using a linear classifier, researchers were able to identify severe offenders with 82% accuracy. Their model relied on features built from unigrams, bigrams, and Yelp star-ratings to achieve this result.

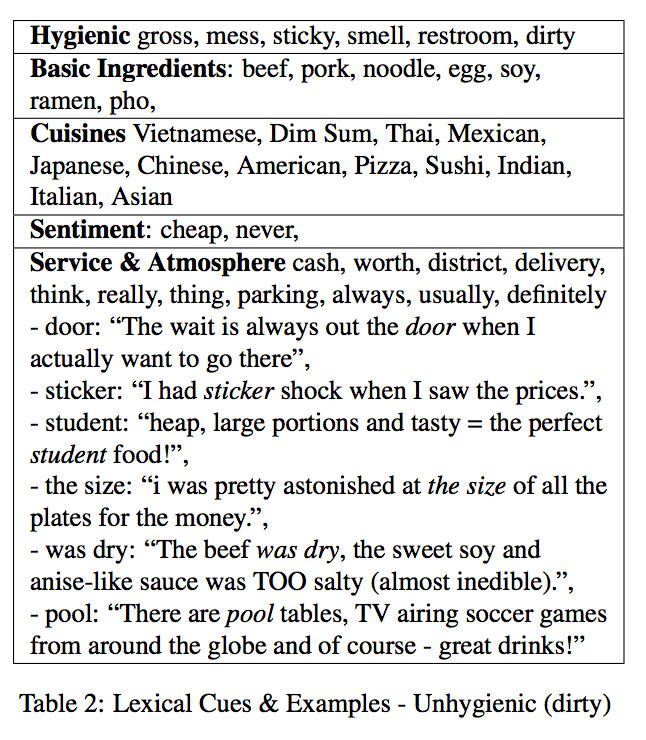
To make things a little more interesting, we got things started on this new set of data for the City of Boston. Using bigram features--that is, pairs of words that appear together--we determined which were correlated with more violations. Bigrams that indicated more violations included:

  • don ask
  • make reservations
  • fried oysters
  • corn cob
  • don think ll
  • hours later
  • bit slow
  • food mediocre
  • hour wait

And, bigrams that indicated fewer violations included:

  • liked place
  • lot fun
  • nice bar
  • cocktail list
  • glasses wine
  • order drinks
  • gourmet dumpling
  • heard good
  • hang friends
  • great things
  • like atmosphere
  • good food good

There may be some clues in there, but we're betting you can do better. The competition will accept submissions for eight weeks. Submissions will be evaluated on fresh hygiene inspection results during the six weeks following the competition; after that, the prizes will be awarded. Your submission will not only put you in the running for the prize – it has the chance to transform how city governments ensure public health.

What are you waiting for? These reviews aren't going to parse themselves!

Stay updated

Join our newsletter or follow us for the latest on our social impact projects, data science competitions and open source work.

There was a problem. Please try again.
Subscribe successful!
Protected by reCAPTCHA. The Google Privacy Policy and Terms of Service apply.

Latest posts

All posts

insights

Life beyond the leaderboard

What happens to winning solutions after a machine learning competition?

winners

Meet the winners of Phase 2 of the PREPARE Challenge

Learn about how winners detected cognitive decline using speech recordings and social determinants of health survey data

resources

Open-source packages for using speech data in ML

Overview of key open-source packages for extracting features from voice data to support ML applications

tutorial

Getting started with LLMs: a benchmark for the 'What's Up, Docs?' challenge

An introduction to using large language models via the benchmark to a document summarization challenge.

winners

Meet the Winners of the Goodnight Moon, Hello Early Literacy Screening Challenge

Learn about the results and winning methods from the early literacy screening challenge.

resources

Where to find a data job for a good cause

Finding data jobs for good causes can be difficult. Learn strategies, job lists, and tips to find organizations with open positions working on causes you care about.

winners

Meet the Winners of the Youth Mental Health Narratives Challenge

Learn about the winning solutions from the Youth Mental Health Challenge Automated Abstraction and Novel Variables Tracks

winners

Meet the winners of the Forecast and Final Prize Stages of the Water Supply Forecast Rodeo

Learn about the winners and winning solutions from the final stages of the Water Supply Forecast Rodeo.

insights

10 takeaways from 10 years of data science for social good

This year DrivenData celebrates our 10th birthday! We've spent the past decade working to use data science and AI for social good. Here are some lessons we've learned along the way.

tutorial

Goodnight Moon, Hello Early Literacy Screening Benchmark

In this guest post from the MIT Gabrieli Lab, we'll show you how to get started with the literacy screening challenge!

tutorial

Youth Mental Health: Automated Abstraction Benchmark

Learn how to process text narratives using open-source LLMs for the Youth Mental Health: Automated Abstraction challenge

winners

Meet the winners of Phase 1 of the PREPARE Challenge

Learn about the top datasets sourced for Phase 1 of the PREPARE Challenge.

resources

Teaching with DrivenData Competitions

Inspiration and resources for teaching students data science, machine learning, and AI skills with DrivenData competitions.

winners

Meet the winners of the Pose Bowl challenge

Learn about the top solutions submitted for the Pose Bowl: Spacecraft Detection and Pose Estimation Challenge.

winners

Meet the winners of the Water Supply Forecast Rodeo Hindcast Stage

Learn about the winning models for forecasting seasonal water supply from the first stage of the Water Supply Forecast Rodeo.

tools

Cookiecutter Data Science V2

Announcing the V2 release of Cookiecutter Data Science, the most widely adopted data science project template.

resources

How to make data science projects more open and inclusive

Key practices from the field of open science for making data science work more transparent, inclusive, and equitable.

winners

Meet the winners of the Kelp Wanted challenge

Dive into the solutions from the super segmenters who best detected kelp in Landsat imagery!

winners

Meet the winners of the SNOMED CT Entity Linking Challenge

Meet the winners with the best systems for detecting clinical terms in medical notes.

winners

Meet the winners of the Pale Blue Dot challenge

Learn about the top visuals created for the Pale Blue Dot: Visualization Challenge and the solvers behind them.

Work with us to build a better world

Learn more about how our team is bringing the transformative power of data science and AI to organizations tackling the world's biggest challenges.