
Detecting Anomalies in Energy Consumption
Background
Energy consumption of buildings has steadily increased. There is an increasing realization that many buildings do not perform as intended by their designers. Typical buildings consume 20% more energy than necessary due to faulty construction, malfunctioning equipment, incorrectly configured control systems and inappropriate operating procedures.
The building systems may fail to meet the performance expectations due to various faults. Poorly maintained, degraded, and improperly controlled equipment wastes an estimated 15% to 30% of energy used in commercial buildings.
Therefore, it is of great potential to develop automatic, quick-responding, accurate and reliable fault detection and to provide diagnosis schemes to ensure the optimal operations of systems to save energy.
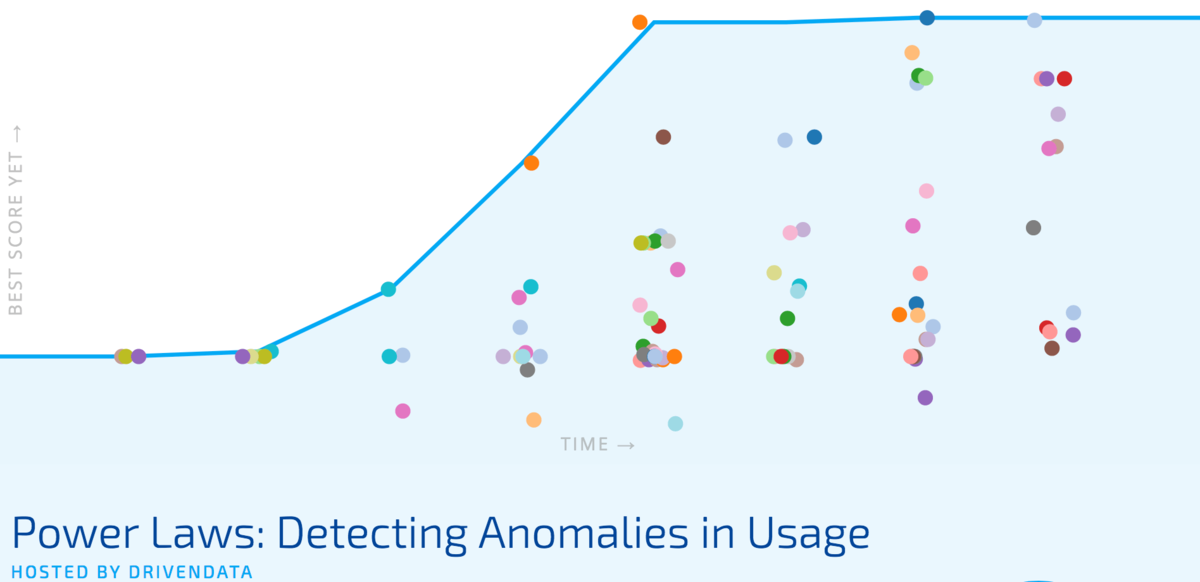
** In this competition data scientists all over the world built algorithms to identify anomalous enery consumption. **
Identifying anomalies was a tricky task, and the best performers combined human judgment with machine suggestions. Winners documented these approaches and sugggested new ways of thinking about anomalies in the context of energy usage. Ultimately, these ideas can help drive forward the kinds of anomalies that we hope to identify in building energy use.
Meet the winners below and hear how they applied machine learning to the important challenge of detecting anomalies in building energy use!
Meet the winners
Team PINGANAI (Li Ying Zheng, Hong Shen Sun)

|

|
Place: 1st
Prize: €10,000
Hometowns: Shenzhen and Shanghai, China
Username: PINGANAI ( daisyhyun, PINGANAI)
Background:
Li Ying Zheng and Hong Shen Sun both work as data scientists.
Summary of approach:
We mainly used two algorithms to detect anomalies: Isolation Forest for weekends (including holidays) and XGBoost for weekdays.
We find that Isolation Forest is very effective in detecting weekend anomalies, but not that good for weekday anomalies. (It’s also possible that the abnormal patterns we find out are anomalies, but not labeled as anomalies.) So for weekday data, we adopt XGBoost to predict power values, and select out anomalies based on the residuals.
Check out PINGAI’s full write-up and solution in the competition repo.
Levi Viana

Place: 2nd
Prize: €4,000
Hometown: Levallois-Perret, France
Username: lviana
Background: My passion about Mathematics came from my results on Math competitions in Brazil, where I was born. Thanks to the gold medal I won in 2006 on the toughest math competition in Brazil (OBMU - Brazilian Math Olympiad for University Students), I was invited to participate in the Ecole Polytechnique's engineering program. I came to France in January 2009, since then, I became a husband, a father of a little boy (Edouard) and an entrepreneur (founder at Wintics).
I finished my studies at Ecole Polytechnique in September 2012. I chose then to start my career at a consulting firm in order to develop some business skills that my academic studies didn't provide me with. I worked for 4.5 years at Accuracy (consulting firm) where most of the time I worked on highly quantitative projects (Financial modelling, Derivatives Pricing and Data Science).
Last year I quit that comfortable job to start a professional adventure : Wintics, a start-up that develops taylor-made AI solutions for corporations.
Summary of approach:
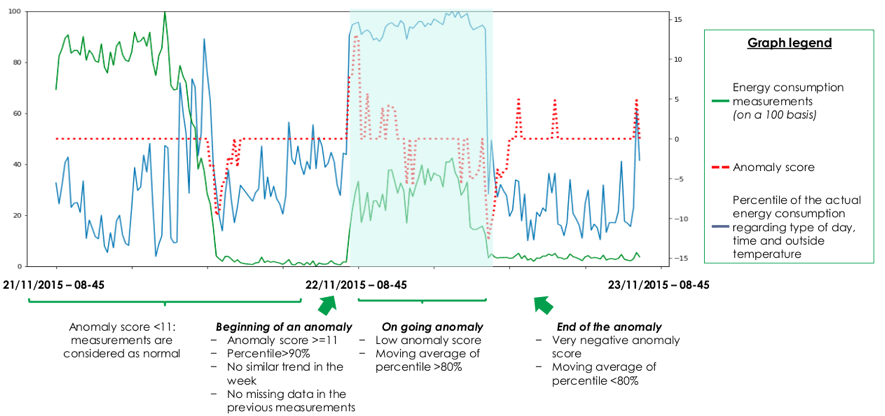
I combine prediction-based and rule-based approaches to detect abnormal energy consumption. The main idea is to fit a machine learning model that predicts the energy consumption for the next timestamp, then we measure kind of the level of “surprise” of the model based on the gap between the prediction and the true consumption. If we find a gap, then either (i) the model actually made a mistake, or (ii) an abnormal energy usage has happened. When detecting overconsumption, we want to avoid the cases where the model just made a mistake. Therefore, we complete our diagnostic with a rule-based approach which basically filters the anomalies found by the predictive model with respect to some statistical criteria. The main metric for the rule-based approach is the percentile of the energy consumption for the timestamp given the (i) hour, (ii) outside temperature and (iii) type of day (working day vs holiday).
Check out lviana's full write-up and solution in the competition repo.
Iana Valiuk

Place: 3rd
Prize: €2,000
Hometown: Moscow, Russia
Username: viana
Background:
I graduated from Bauman Moscow Technical University in 2013 with the master degree in biomedical engineering systems. As a part of my master thesis, I worked on medical image recognition systems. After spending 3 years in Johnson & Johnson company I switched to freelance work with some time left for casual participation in data science competitions.
Summary of approach:
Hand picking and LB probing algorithm taking advantage of optimization metric. Huge penalty for FP answers convinced me to find several concrete examples of anomalies and to get public score around 80%. Other motivation for that was to gain an understanding of what is meant by anomaly. To find these examples I grouped-by observations with similar time related features and marked 4 sigma deviations as anomalies. Then by manually examining groups of anomalies I started LB probing for each meter_id separately. After a week or so I got the expected score. That said, my approaches to finding initial candidates for anomalies might be useful.
Check out viana’s full write-up and solution in the competition repo.
Pavel Kuzmin

Place: Best Report
Prize: €10,000
Hometown: Moscow, Russia
Username: pavel_kuzmin
Background:
Pavel Kuzmin, Moscow Russia. Graduated from Moscow University of Physics and Technology (MIPT) in 2013. Worked in the field of statistical analysis, automatic control, dynamic and statistical modeling. Now data scientist in Severstal Digital (subsidiary company of Severstal - Russian steel and mining company). Specialization now is predictive maintenance of equipment.
Summary of approach:
Pavel created models for identifying anomalies using k-nearest neighbors and neiral networks. After this he explored the kinds of anomalies that were detected using these methods and how identification of anomalies could be improved with additional data.
Check out pavel_kuzmin's full write-up and solution in the competition repo.
Thanks to all the participants and to our winners! Special thanks to Schneider Electric for a fascinating challenge!