What is the "last-mile" problem in public data?
Public data is intended to empower people and deliver social impact. Governments, agencies, and institutions publish datasets to increase transparency, inform the public, and enable research. But anyone who has ever tried to use these datasets knows that just because data is public doesn’t mean it’s accessible, usable, or useful.
Most public datasets come as sprawling collections of CSVs or spreadsheets with schemas that change over time, cryptic column names, and complex data dictionaries. Even if you’re reasonably technical, you can lose days just figuring out what’s what. If you’re not technical, you’re basically locked out from using the data at all.
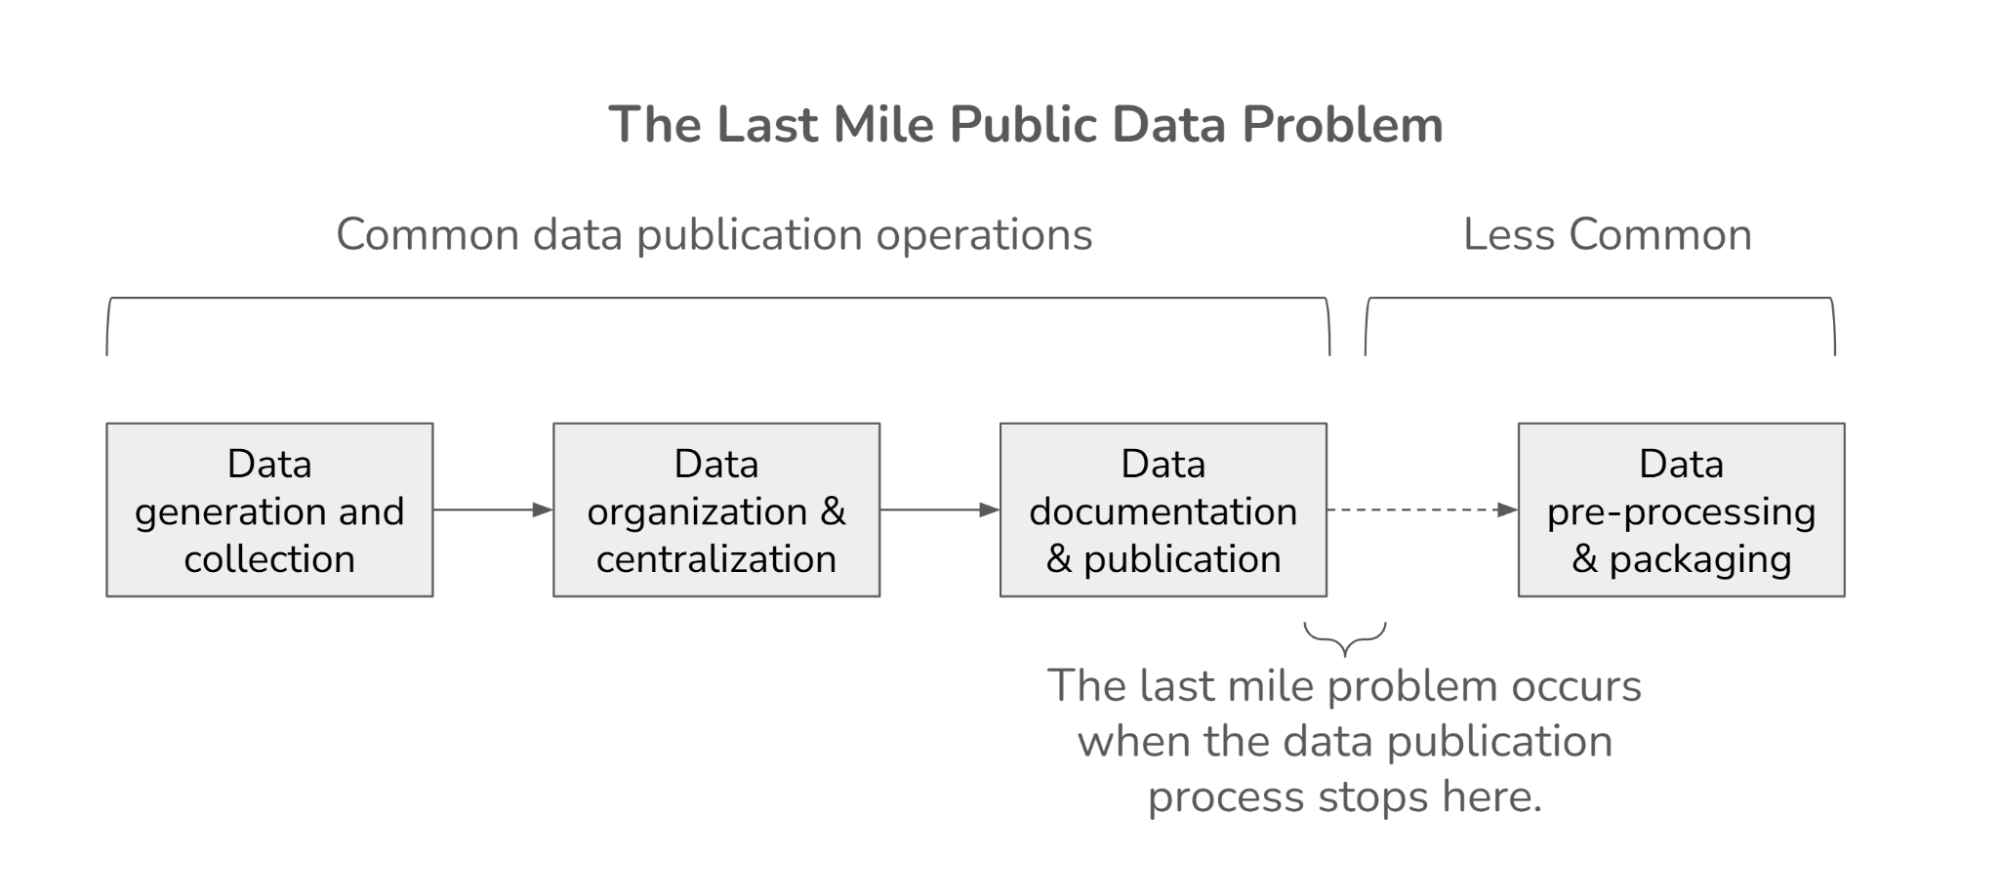
That gap between data that is "published and available" and data that is "directly usable" without a significant amount of preprocessing is what we think of as the last-mile public data problem. It stops countless people, even technical ones, from turning data into useful information.
How a "baked data" approach improves public data usability
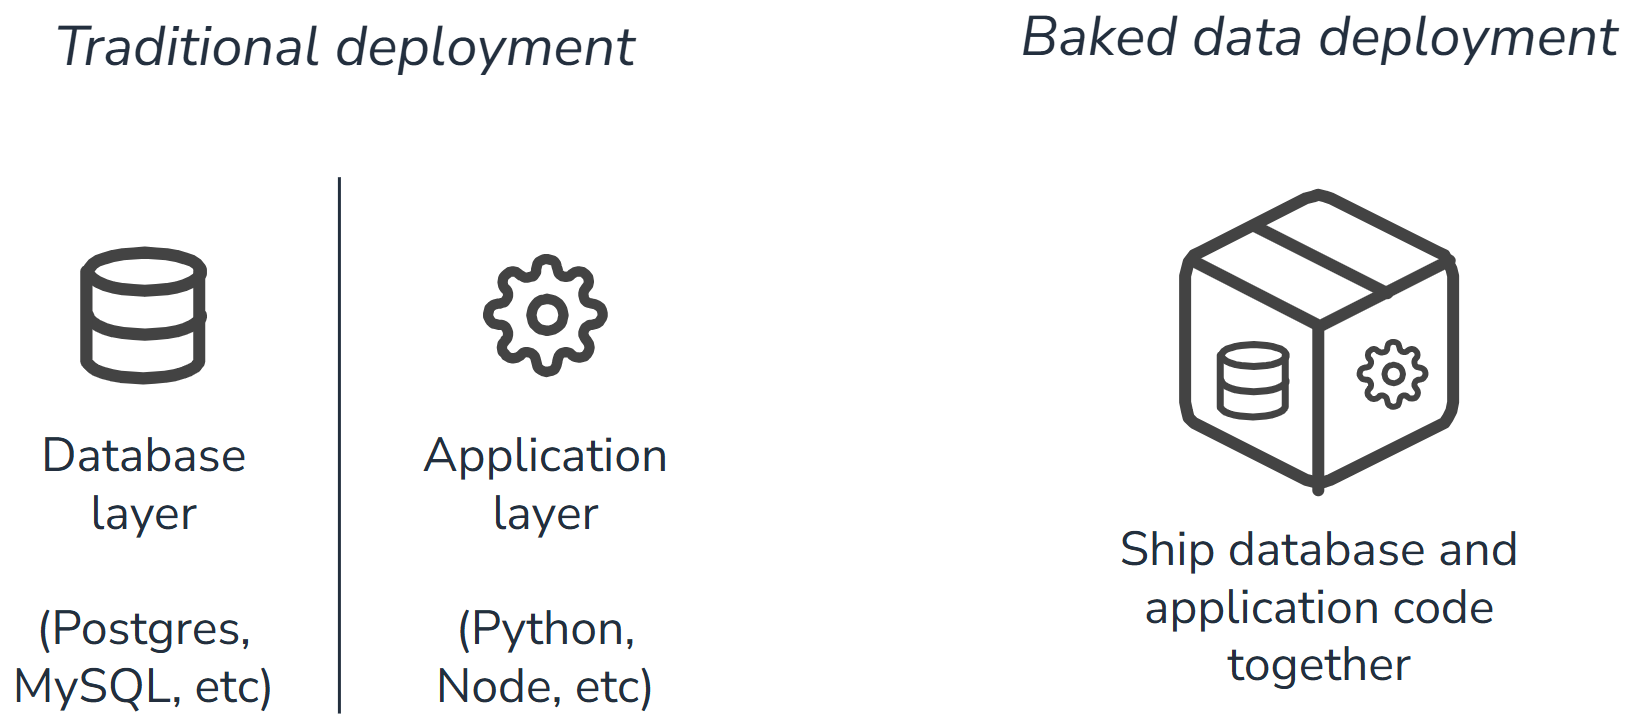
In order to solve this last-mile public data problem, we were inspired by the concept of "baked data," originally defined by Simon Willison as "bundling a read-only copy of your data alongside the code for your application, as part of the same deployment." He coined the phrase after a pattern he used for deploying web applications: instead of pointing your app at some external database over the network, you bundle a read-only copy of the data right alongside your code. The app ships with the data it needs, tightly coupled and easy to deploy.
In our work, we’ve adapted this idea when working with public datasets. Instead of telling people:
"Here are 50 CSV files that you have to munge and preprocess yourself,"
we asked:
"What if we preprocess all of this data once, turn it into a clean, queryable database, and ship that as a single portable file?"
In order to do this, we chose DuckDB as our database. DuckDB is an OLAP (online analytical processing) database that runs in-process, making it very fast for aggregation and portable across machines and environments. You can query tables directly with SQL or use bindings in Python (or many other languages). And crucially, it can package an entire analytics-ready dataset into a single file you can drop into a project, a notebook environment, or a small web app.
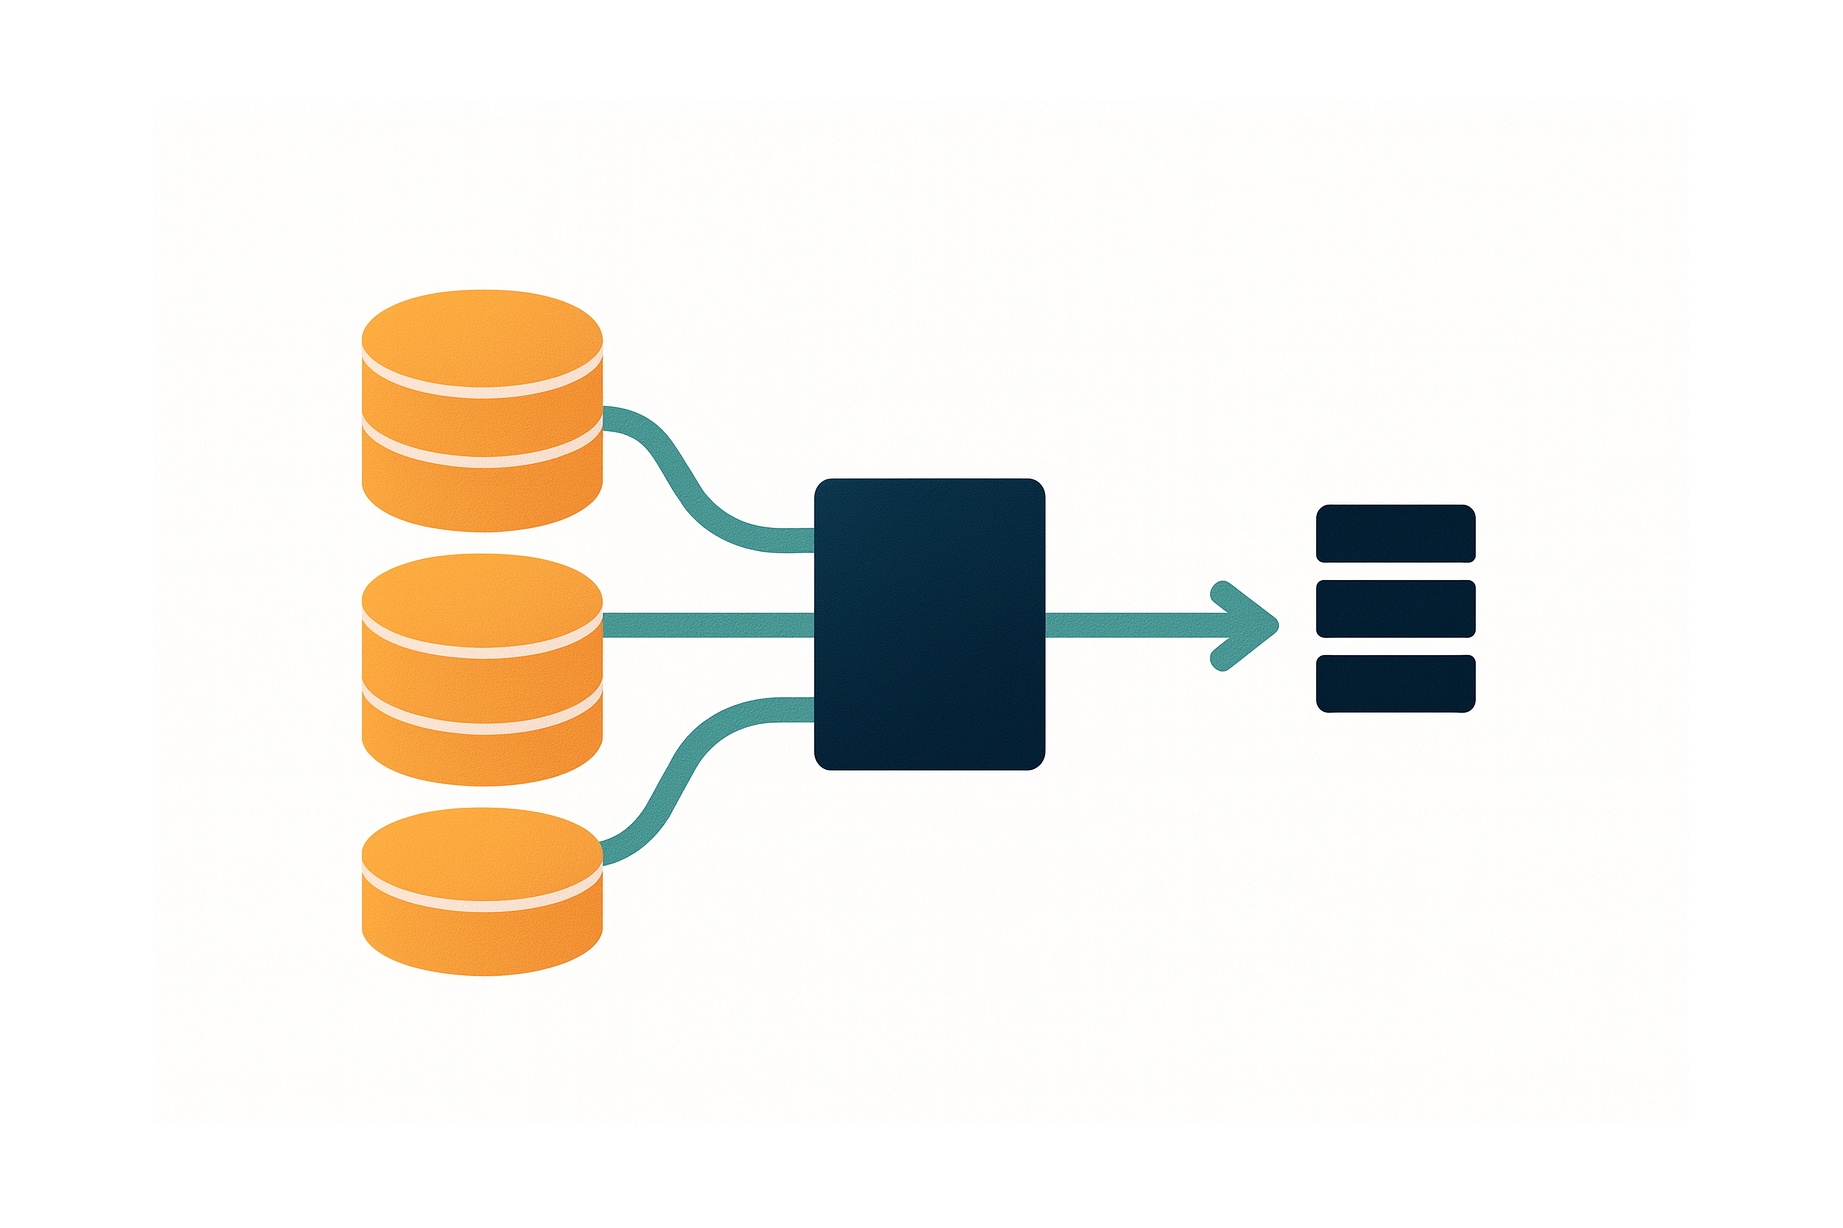
The result is a recipe for "baked public data": you start with the messy public-source data ingredients, you process, combine, and bake, and what you give users is a stable, ready-to-query database.
Case study: Turning IPEDS into a "baked" education dataset
We put this approach into practice in collaboration with Science for America, a solutions incubator that brings together scientists, technologists, and cross-sector partners to develop game-changing initiatives addressing critical societal challenges. Science for America wanted to answer questions about U.S. higher education STEM programs, e.g., how the share of women in STEM has changed over time or how different institutions have evolved.
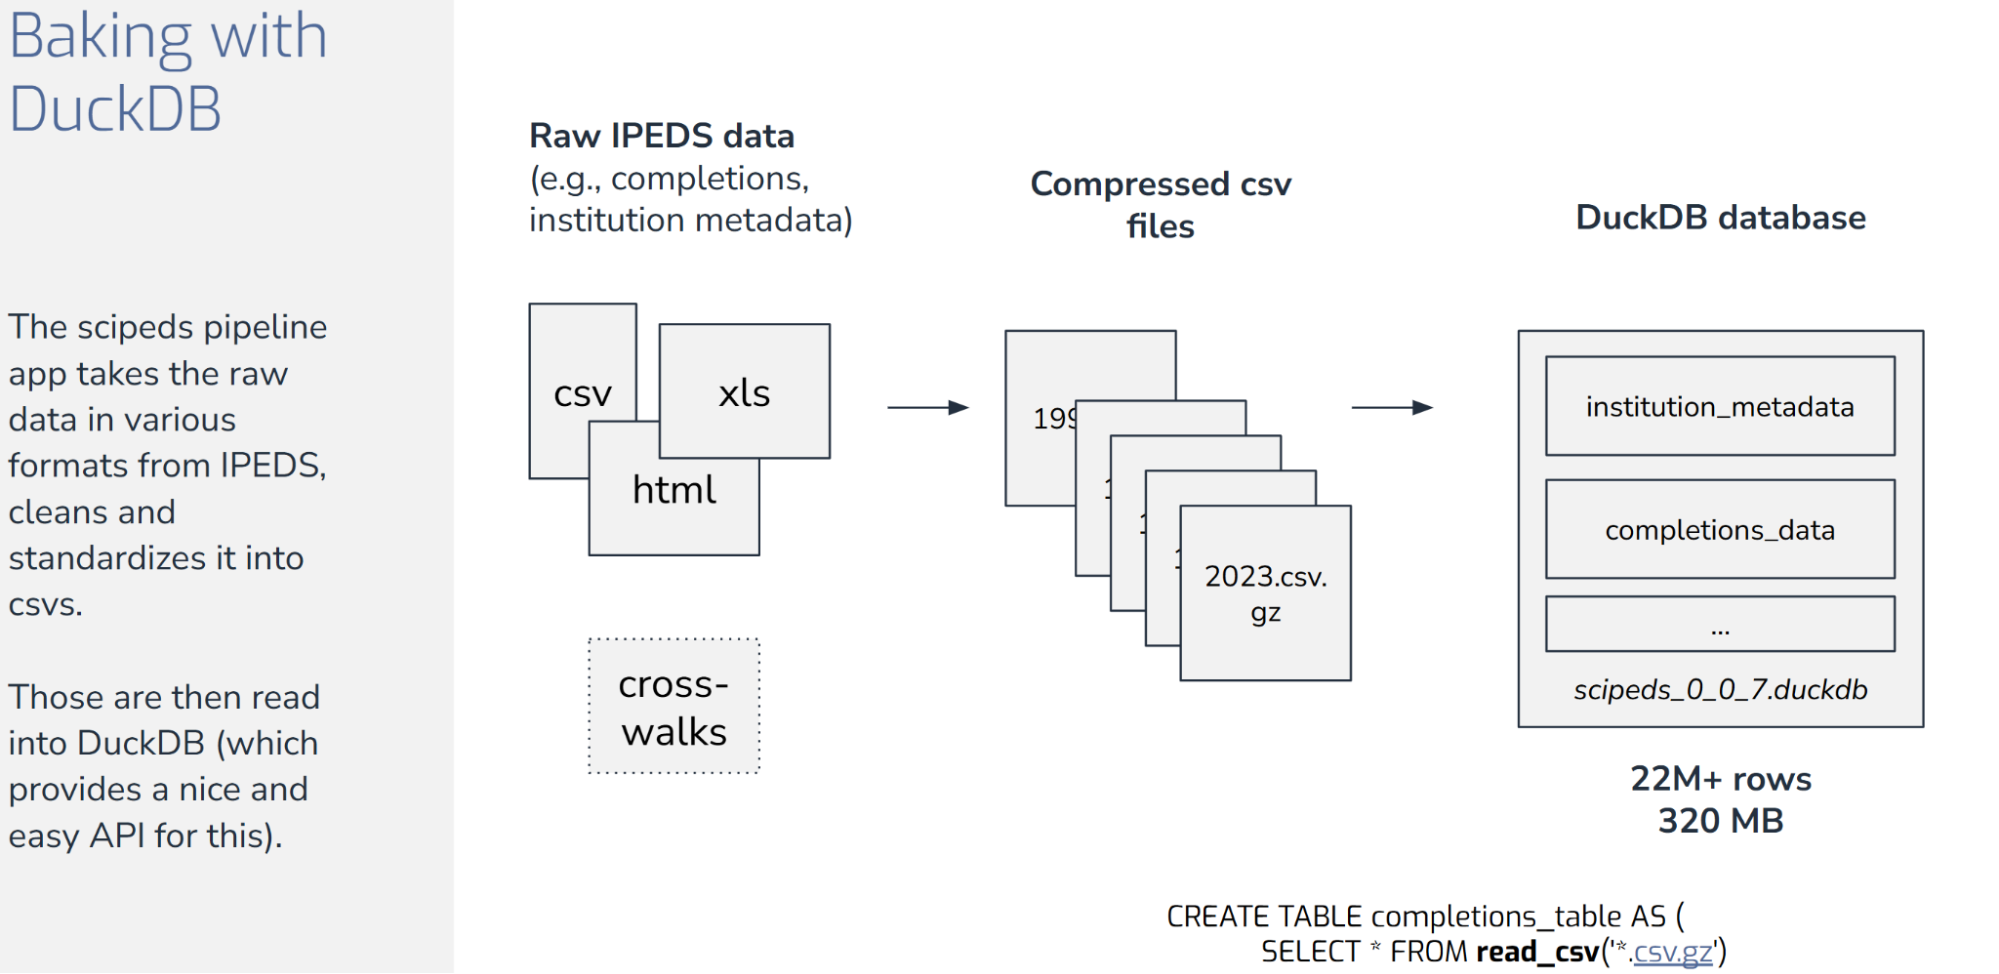
The public data source we started with is IPEDS (the Integrated Post-secondary Education Data System operated by the National Center for Education Statistics). IPEDS is a treasure trove of data that is collected annually from all higher education institutions that participate in federal student aid programs. But IPEDS data suffers from the same challenges discussed earlier. It contains a collection of multiple files per year accumulated over 30 years. Field codes and categorizations have changed over time. Older data dictionaries are only available as HTML files. On top of that, different reporting institutions classify STEM fields differently, creating overlapping taxonomies to reconcile.
To get started, we built a pipeline that pulls all of this data–CSVs, Excel spreadsheets, HTML data dictionaries, crosswalks for code changes–into a normalized relational database. We mapped evolving codes into consistent categories, built standard enumerations for degrees and fields, and stitched together institutional metadata to join data to university characteristics.
At the end of that pipeline, we wrote everything into a .duckdb file. In total, there are about 22 million rows in a ~320 MB file, relational and ready for analytical queries. We version this file and release it alongside the code that generates it, so users can always access a specific snapshot of the data.
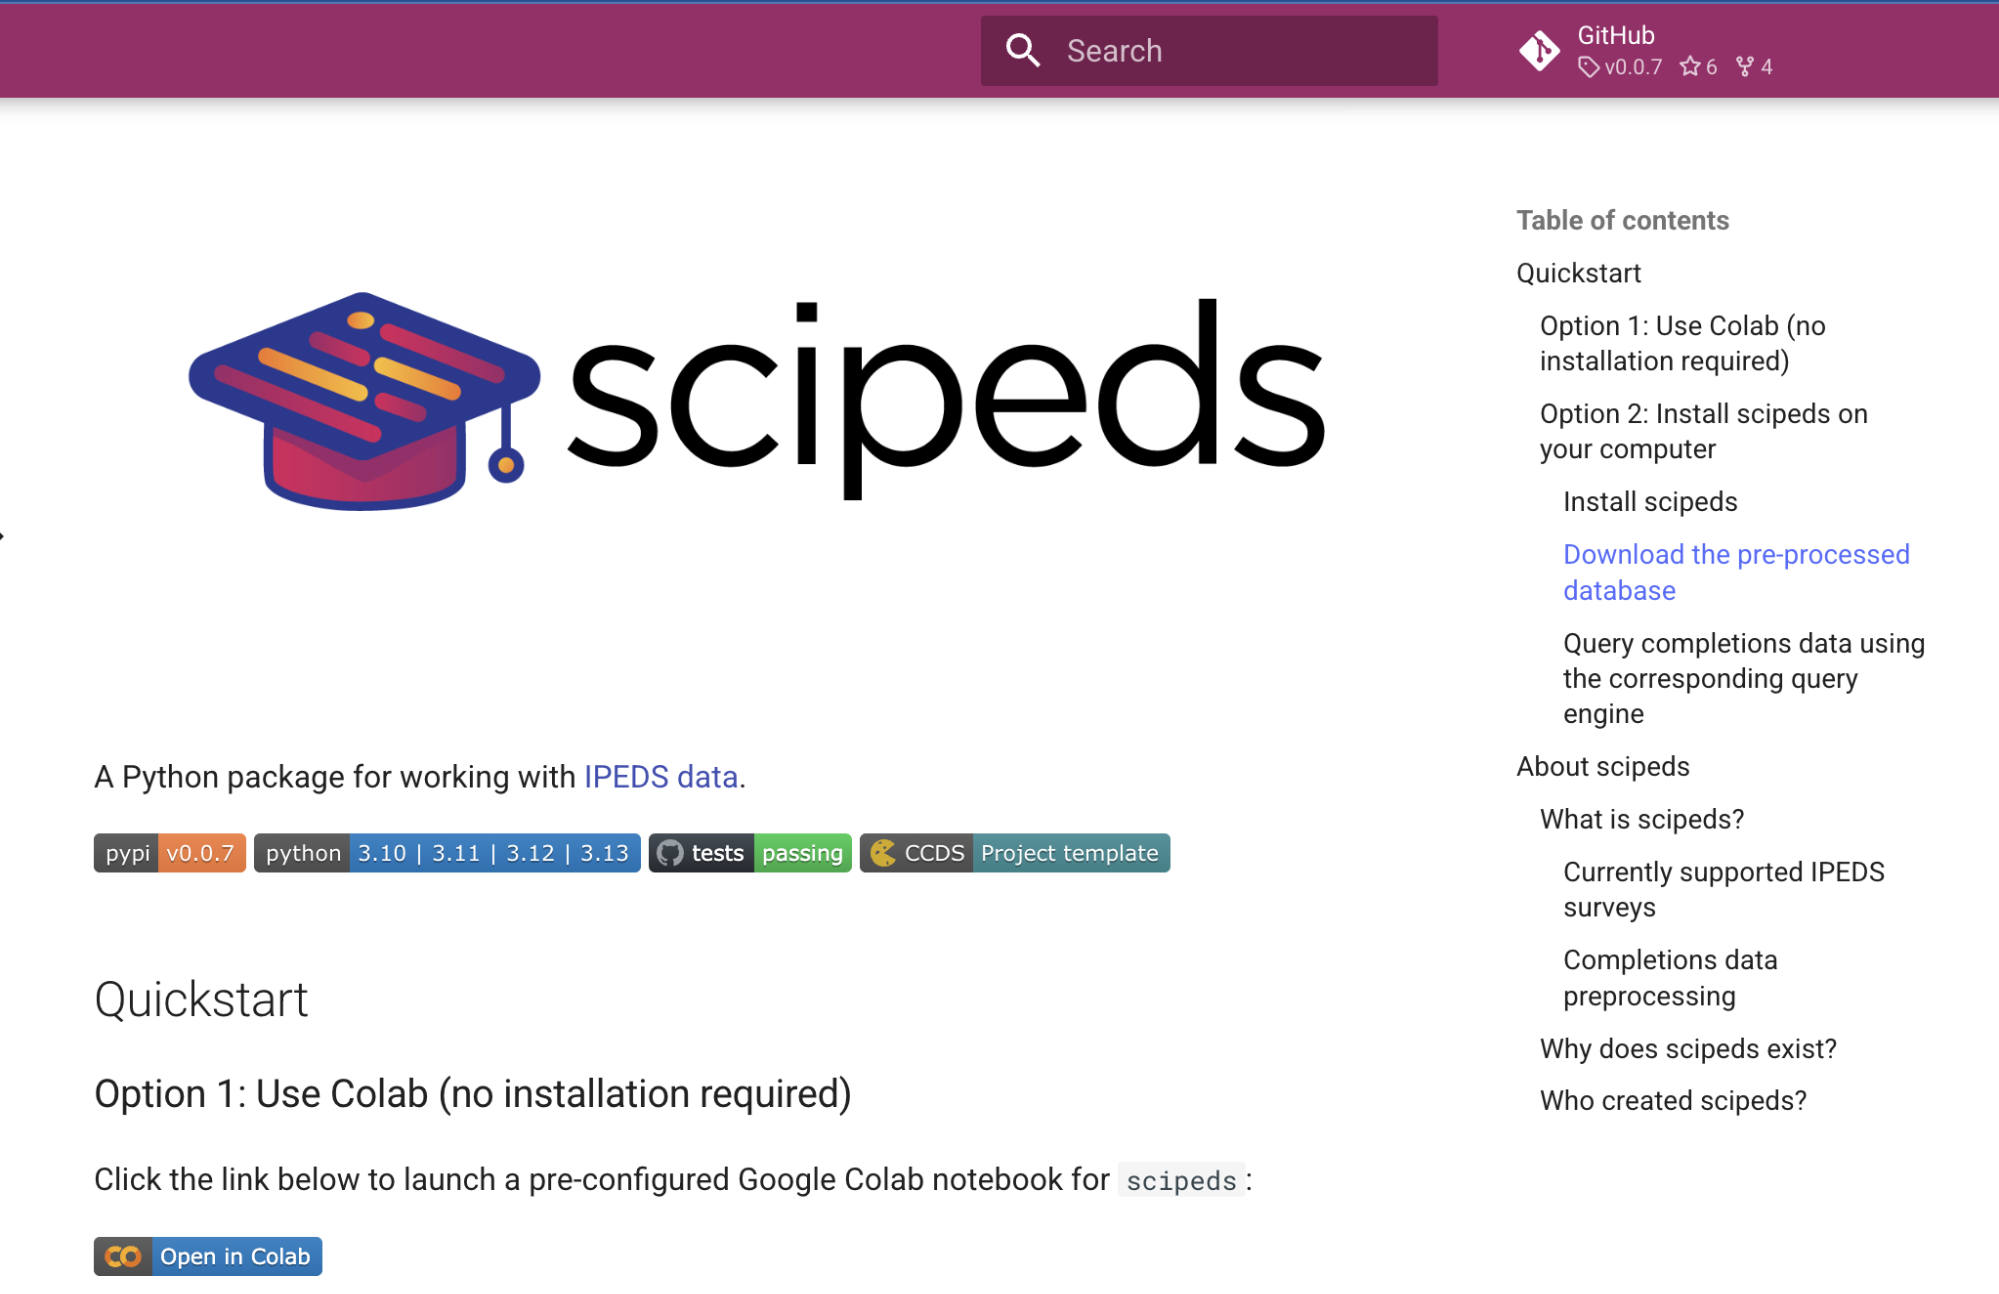
On top of the database, we then built the scipeds Python package. scipeds provides a higher-level query interface so you don’t have to write SQL directly. You define what you’re interested in—say, bachelor’s degrees in STEM, broken out by gender, using a specific STEM taxonomy—and the library generates the appropriate SQL behind the scenes. It knows about built-in taxonomies (such as NCSES or DHS definitions of STEM) and validates query parameters against enumerations while handling low-level schema details internally.
For someone working in Python, that means you can go from "I wonder how women in STEM have changed over time" to a usable time series and a plot in a few lines of code, without manually touching raw IPEDS files.
Making public data useful for the non-technical user
To fully solve the last-mile challenge we set for ourselves, we also had to address the reality that not everyone is going to write Python. So we took the same DuckDB file and dropped it behind a Plotly Dash app, deployed with a modest server: a couple of CPUs and a few gigs of RAM. The web server downloads the database at deploy time, and queries are processed server-side. Despite these modest technical specs, DuckDB’s speed means that filtering and aggregation are still responsive in real-time.
As a result, someone with no technical background can go to the scipeds site (https://www.scipeds.org/), pick an institution, pick a field like Engineering or Computer Science, choose a time range, and explore representation trends interactively. They don’t need to know SQL, Python, or anything about IPEDS data structures. They just see charts that answer the questions they care about.
scipeds exemplifies the advantages of a baked data architecture: one artifact can serve multiple access modes across multiple platforms seamlessly.
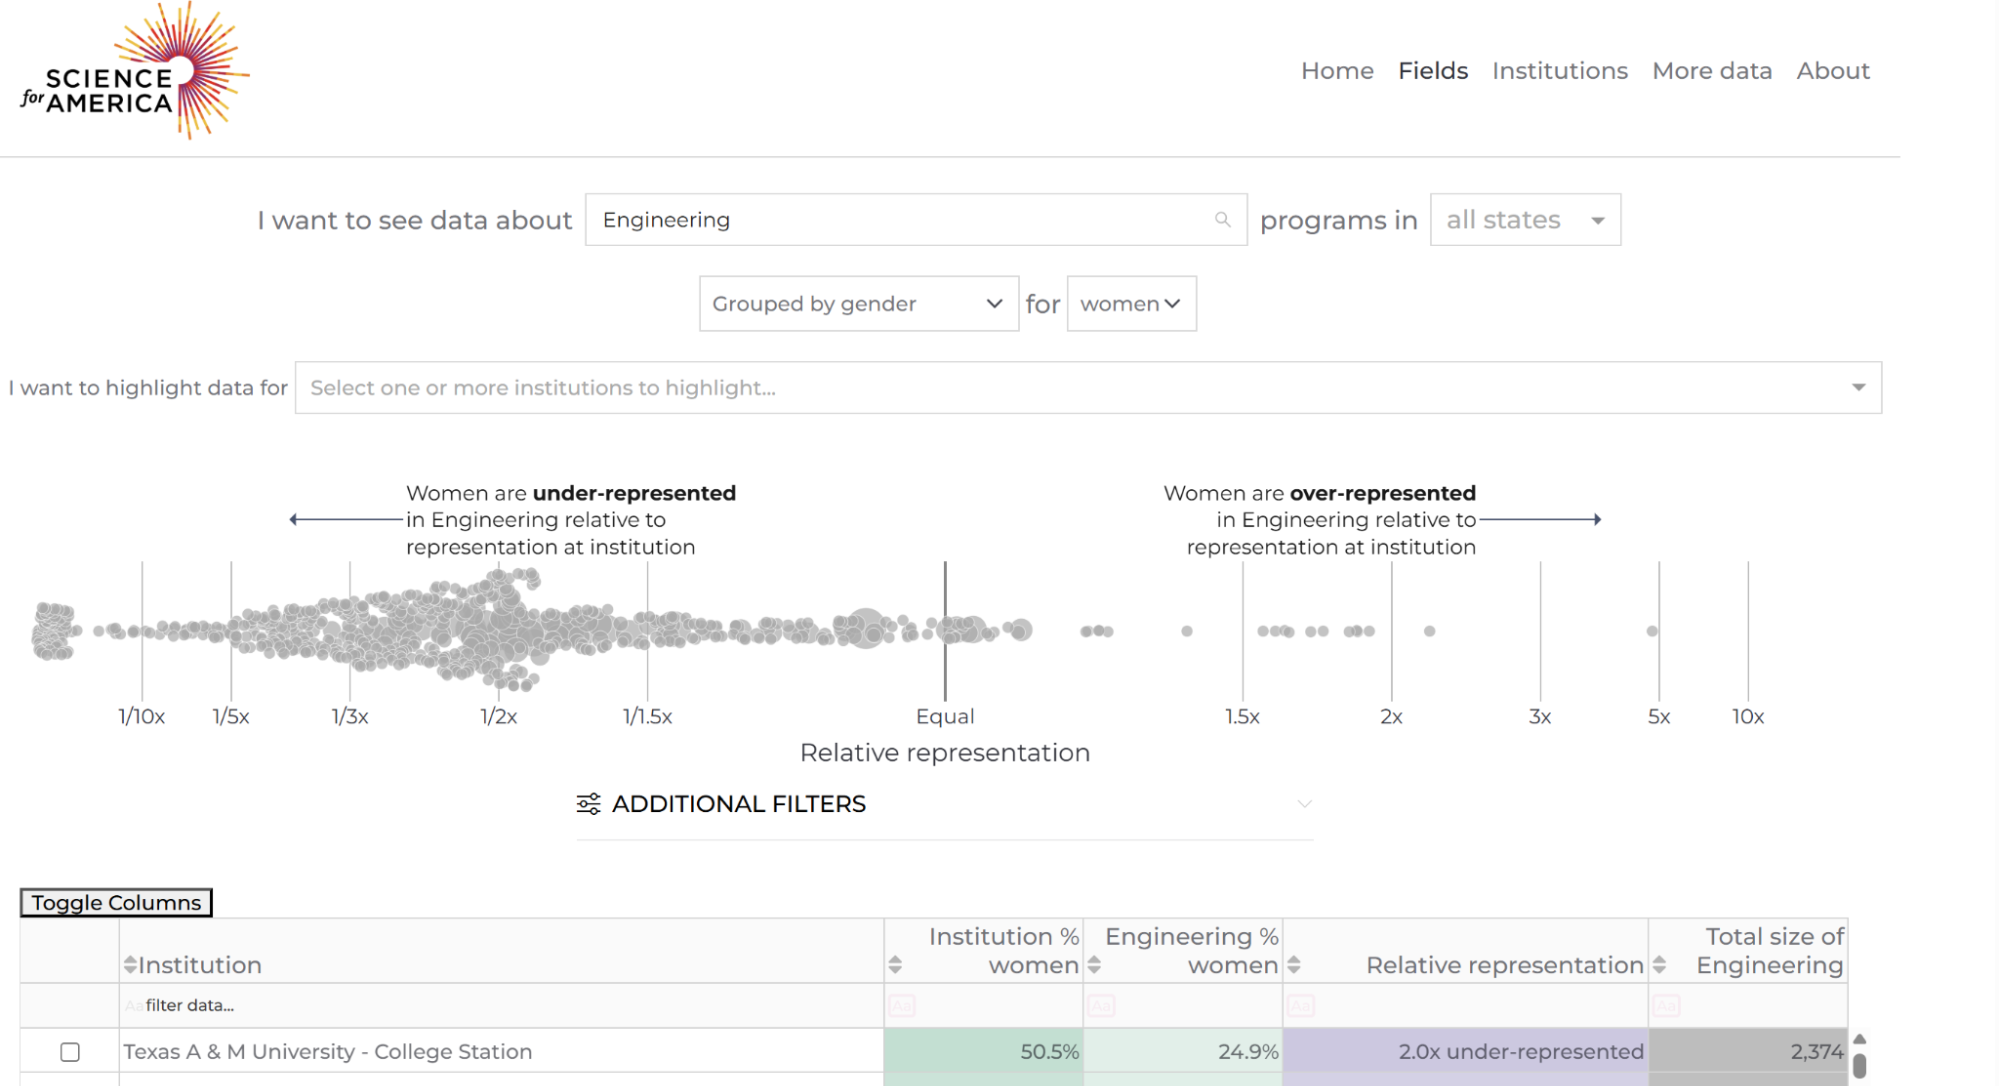
The Plotly dash app on the scipeds site (https://www.scipeds.org/) allows immediate data exploration for non-technical users. We invite you to try it out to ask and answer questions about higher education for yourself!
Baked data is a reproducible approach that improves public data access and usability
Before this work, answering a seemingly simple question from IPEDS like "How has the number of women studying STEM changed over time in the U.S.?" meant digging through a pile of heterogeneous files and patching together lots of one-off logic. Now it’s a small, readable query on a single database or a visit to a webpage.
From a deployment perspective, things are simpler too. There’s no separate hosted database cluster to maintain. For most use cases, you just need to download the DuckDB file where your code or web app can reach it.
Because of the bundling of data and application, our baked data approach delivers an additional reproducibility benefit. If someone uses scipeds for an analysis and wants to recall or reproduce it later, they can pull the same version of the package and the same underlying database. This works because the DuckDB file is generated during the release process and versioned alongside the code. In essence, every library release corresponds to a particular state of the data.
When the baked data pattern works, and when it doesn’t
Three things became obvious while building scipeds. We present these as lessons learned for future developers of baked data systems.
-
Everything depends on the data pipeline.
If you don’t invest fully in turning messy public data into a consistent, analysis-ready dataset, the recipe doesn’t work. Taking care of the enumerations, taxonomies, standardized concepts, and so forth—the work of data analysts, data engineers, or data scientists—is what bakes the data so users can answer their questions without constantly tripping over schema quirks. -
DuckDB is a powerful and portable tool.
It gives data scientists a familiar SQL engine, Python users a clean API, and application developers a simple, portable artifact that is much faster for analytical queries than an OLTP SQLite database. With DuckDB you don’t need heavyweight infrastructure to get serious analytical performance from structured datasets. -
Accessibility must be layered to make the data truly accessible and useful.
Some people are happy writing SQL. Some are comfortable in Python but not SQL. Some aren’t going to open a notebook ever. If you want a public dataset actually to be used by your target audience, you need to meet them at their level, whether that's a database, a language wrapper, or a UI.
Finally, we want to acknowledge that this approach isn’t a silver bullet for all types of public data. It works best for structured data that’s small to mid-sized and relatively static. If you’re dealing with streaming data, petabyte-scale logs, or purely unstructured text, you’re in a different territory. And you still have to solve the unglamorous problems of hosting and paying for whatever you put on the web.
If any of the above more complex scenarios apply to your situation, reach out. We love a challenge!
How to achieve the gold standard for published public data: useful, usable, and used
Solving the last mile problem for public data isn’t about publishing more instructions and data dictionaries; it’s about whether someone with a real question can get a real answer without drowning in data munging. The baked data approach that underlies scipeds is a simple, reproducible recipe for closing the last-mile gap in three steps:
- Do the heavy integration work up front,
- package the result as a portable analytical database, and
- give people multiple paths into it.
Public data has huge value, and the investment that organizations make into its creation is significant. When it is easily and directly usable, it achieves its full potential for social impact.
Dive deeper: Watch a detailed slide presentation about solving the last-mile public data problem using baked data by Senior Data Scientist Chris Kucharczyk here. For more information about the scipeds application, see this case study here.
How well does your published data address the last-mile problem? DrivenData offers free last-mile data problem evaluations. Get in touch here.