The challenge
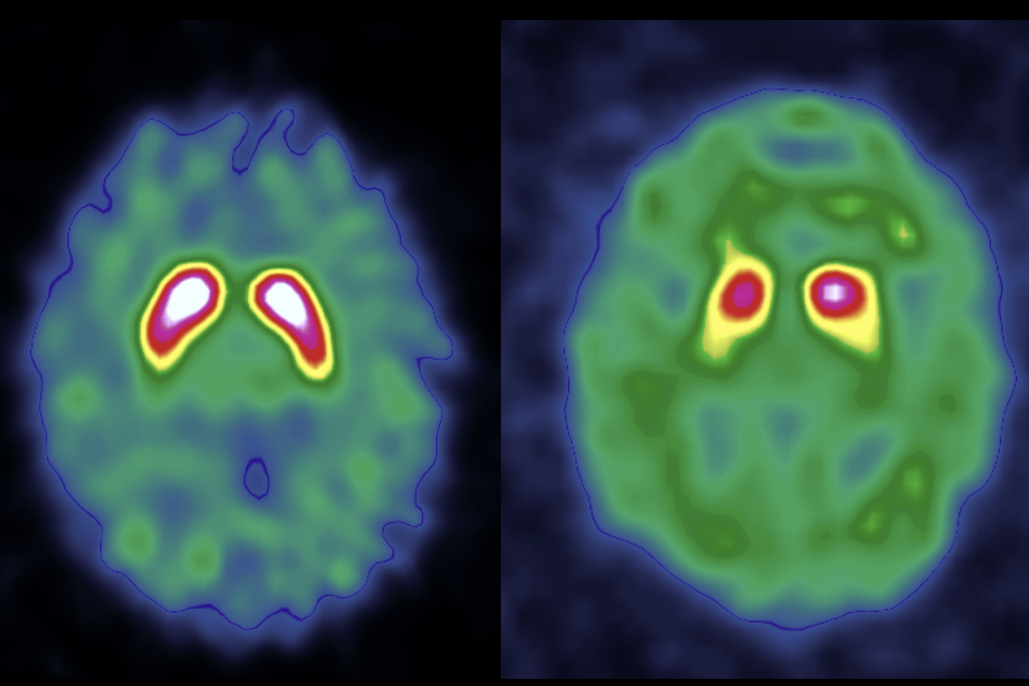
Parkinsonian syndromes affect millions of people worldwide, and diagnosing them accurately and early is difficult. Dopamine transporter (DaT) imaging helps clinicians distinguish neurodegenerative parkinsonian syndromes from other conditions, but reading these scans reliably takes specialized expertise in nuclear medicine, which is not available everywhere.
About one in five DaT scans is difficult to interpret, especially in early-stage or atypical cases, which delays diagnosis and complicates treatment decisions. AI tools that read DaT scans accurately and consistently could help expand access to expert-level diagnostic support and accelerate research into neurodegenerative disorders.
The goal of the DaT Parkinson's Challenge was to develop computer vision models that classify DaT scans as normal or abnormal.
The challenge was organized by the French Society of Nuclear Medicine (SFMN), in partnership with France's Health Data Hub and GaelO, as part of the Health Data Challenges program supported by France 2030. Participants trained models on a multicenter dataset of DaT scans collected and annotated by nuclear medicine experts across ten hospital centers in France. Submissions were ranked by log loss, which rewards models that are both accurate and well calibrated in how confident they are.
The winning models will be released as open source and indexed in the Bibliothèque Ouverte d'Algorithmes en Santé (BOAS), France's open health algorithm library, and the dataset will be made available as open data on data.gouv so clinicians and researchers can build on this work.
Results
1,009 participants joined the challenge and made 2,219 submissions. Each model received a single 3D DaT scan and had to predict the probability that a nuclear medicine reader would report it as abnormal. Models were scored by log loss on a hidden test set of 524 scans.
The 1st place team, The Avengers, finished ahead with a log loss of 0.2532. 2nd and 3rd place were nearly tied: NavAttack (2nd) finished at 0.2731 and paulonium (3rd) at 0.2732, a difference of 0.0001. All three winners reached an AUROC of about 0.95.
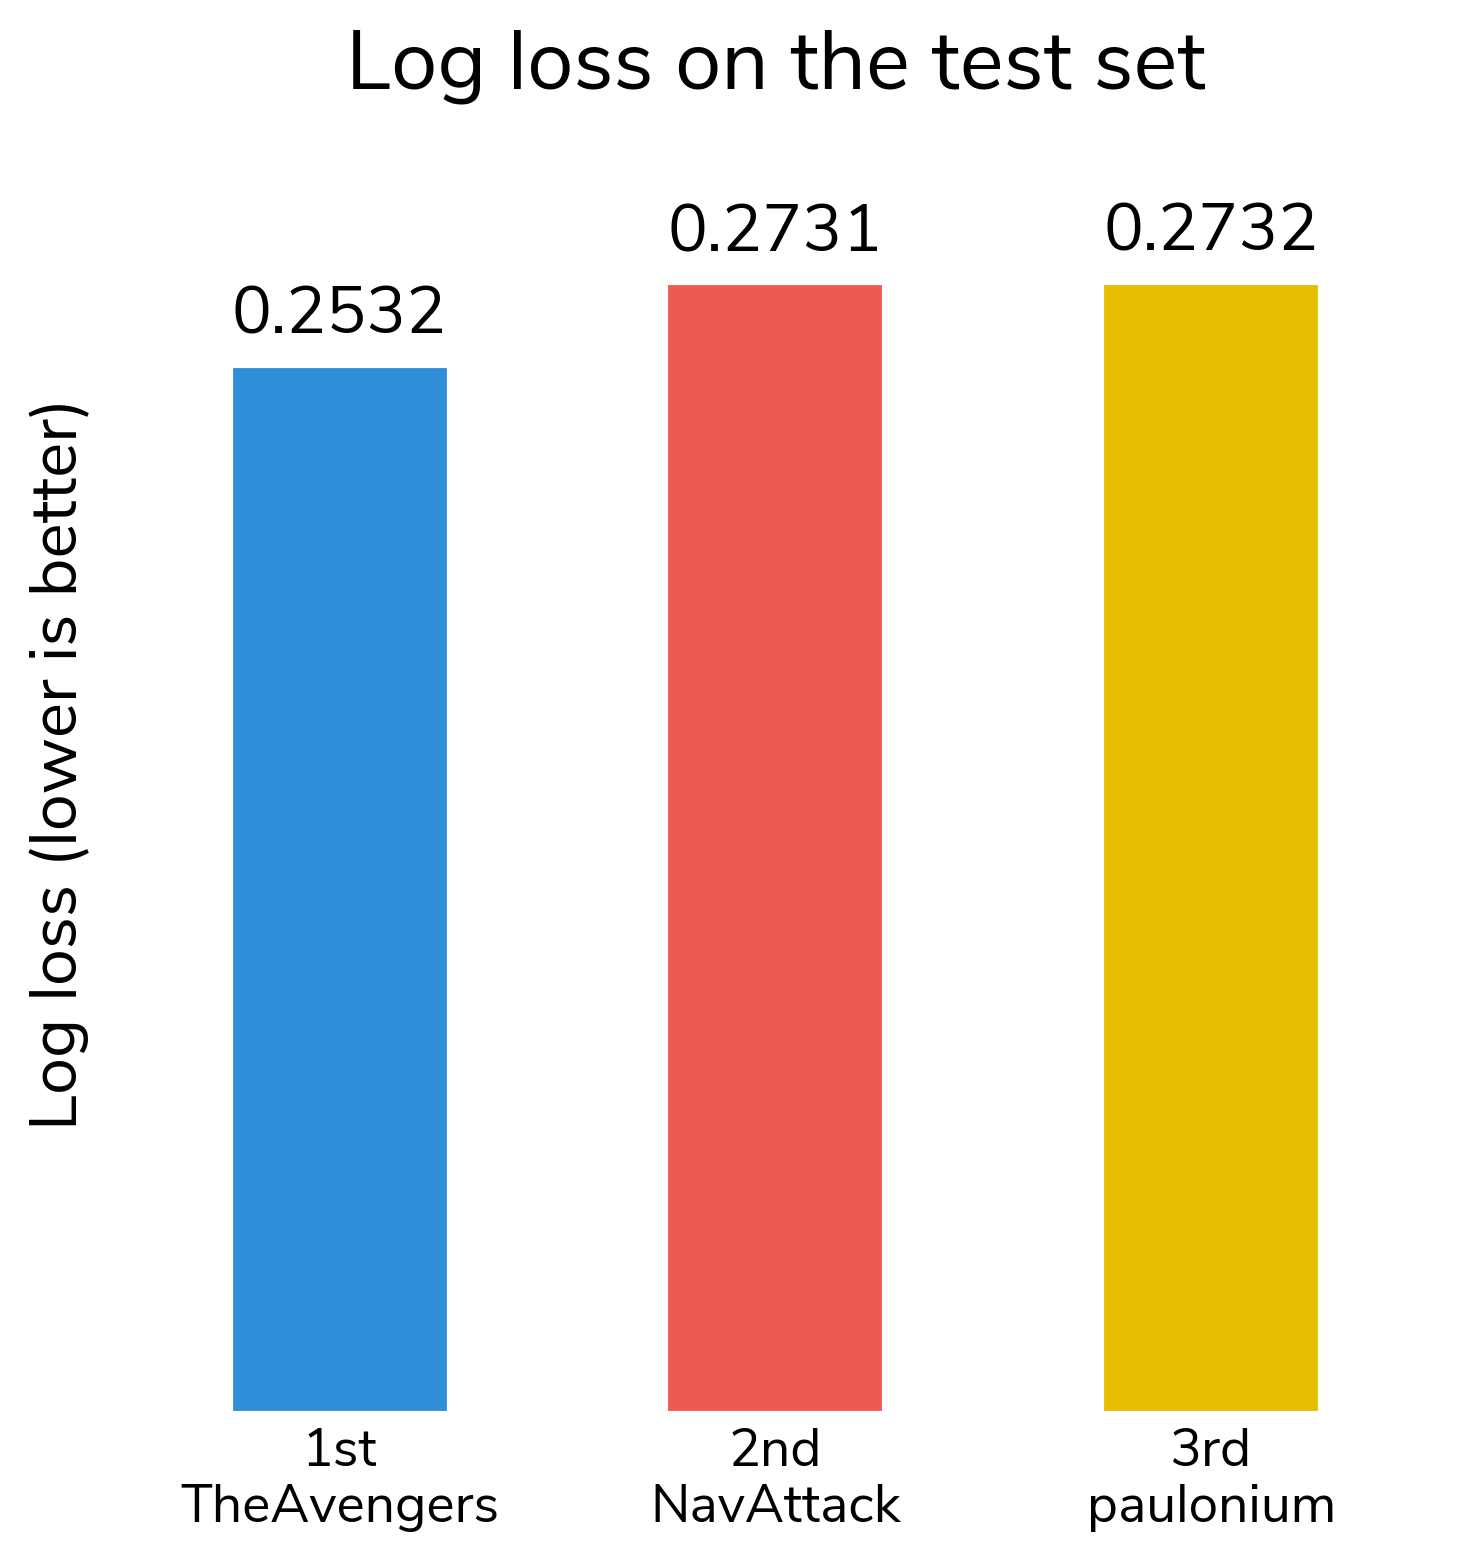
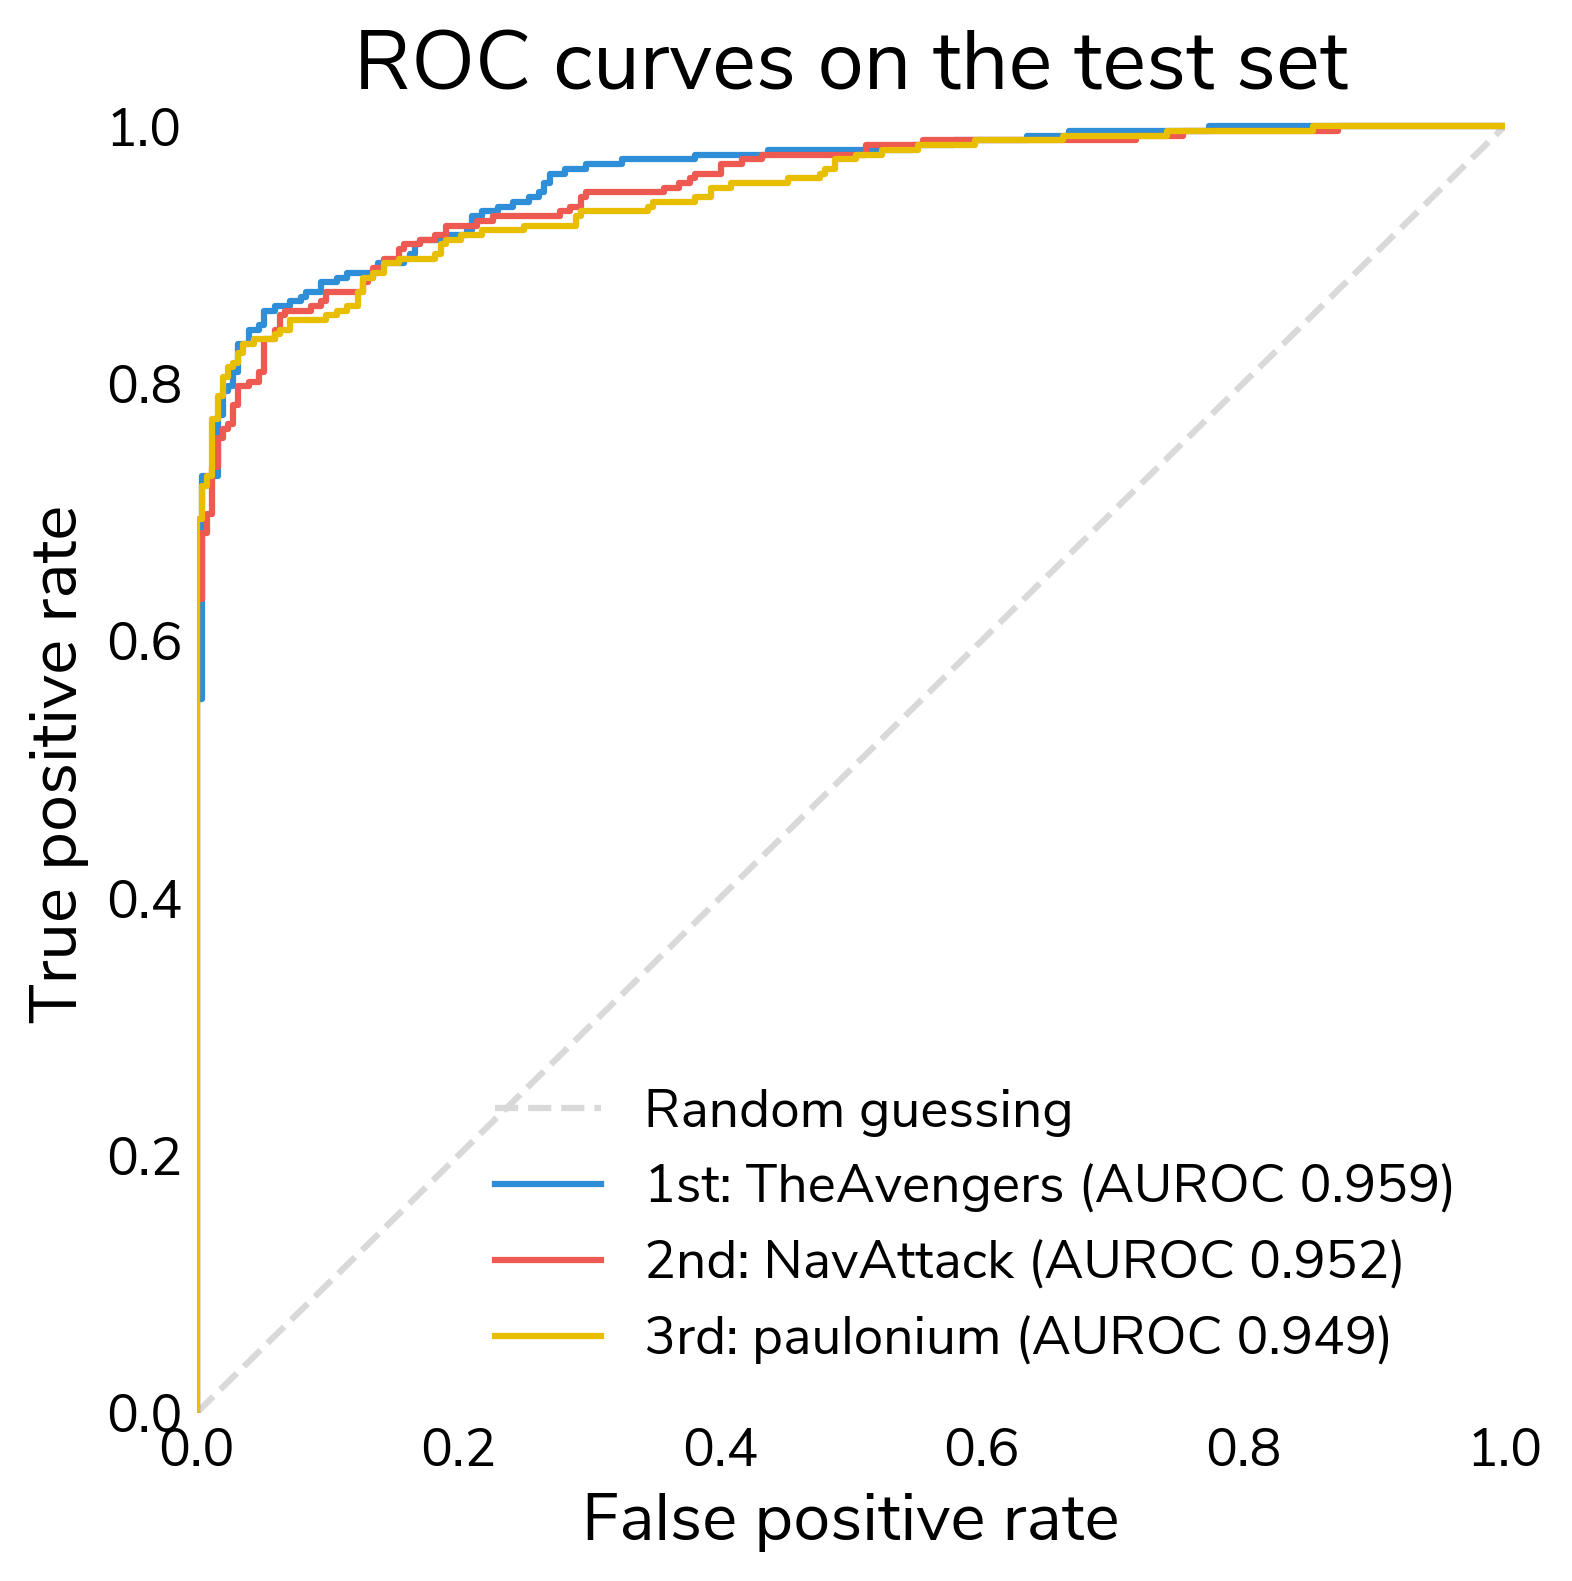
The 1st place lead mostly comes from better-calibrated predictions. At a 0.5 threshold, the three winners misclassified almost the same number of test scans (57, 58, and 60 of 524).
The hardest scans were hard for everyone. 41 of the 524 test scans (8%) were misclassified by all three models. This fits the challenge's motivation: about one in five DaT scans is difficult to interpret, even for experts.
Key takeaways from winning approaches
- Winners built in what clinicians know about Parkinson's. All three solutions focus on the striatum and compare the two hemispheres, because parkinsonian loss of dopamine usually starts on one side. The Avengers split the striatum into left and right halves and passed them through a Siamese network. NavAttack's 3D network scores each hemisphere separately and calls a scan abnormal if either side looks depleted (i.e., does not require both sides). NavAttack and paulonium, a nuclear medicine physician, also targeted the loss of uptake in the posterior putamen, which typically appears first.
- 2D views and models play an important role. The Avengers preprocessed the challenge data to produce close-up 2D views of the striatum, and also used some 3D models to soft-label synthetic data. NavAttack's ensemble uses both 2D EfficientNet models and a 3D network. paulonium found that reducing each scan to a few 2D maps of key features and feeding them to a standard 2D CNN achieved lower log loss than 3D networks, so his final model uses no 3D networks.
- Synthetic data helped make up for a small dataset. The Avengers added soft-labeled synthetic DaT PET scans from Won et al., 2025 as extra training data. These scans come from a different imaging technique (PET rather than SPECT), but they still regularized training. paulonium created mildly abnormal examples by simulating dopamine loss in real normal scans, which targets the borderline cases where most errors happen. NavAttack estimated that doubling the training data would further improve his score.
- Handling differences between scanners mattered. Scans came from many different sites with no acquisition metadata. One of NavAttack's biggest improvements came from fixing how each scan's background uptake was measured. paulonium and NavAttack both avoided normalizing the size of the striatum. paulonium found that striatal length alone reaches 0.89 AUROC, and NavAttack found that a registration step that allowed rescaling "registers the disease away."
- Ensembling and calibration both mattered. The Avengers averaged 100 models (and used an ensemble of different model types for soft labeling PET scans), paulonium averaged 50, and NavAttack blended four model families. Averaging many models smooths out noisy predictions from a small training set. NavAttack and paulonium also calibrated their final probabilities with temperature scaling.
- Some strong results did not need much compute. The Avengers used the most compute, about 3.5 days on two GPUs, mostly to create soft labels for the synthetic data. NavAttack trained his entire solution on a laptop in about six hours. paulonium trained in about 12 hours on three GPUs.
- More clinical context could help. The winners pointed to data that was not available in the challenge: patient age and sex (which may affect normal striatal size), scanner and reconstruction settings, follow-up diagnoses, and scans over time. NavAttack expects follow-up diagnoses to help most with the hard scans that all of his pipelines still get wrong.
Winner overview
| Place | Winner | Prize | Log loss |
|---|---|---|---|
| 1st Place | The Avengers (Dinh-Viet-Toan Le and Samuel Ansel) | €12,500 | 0.2532 |
| 2nd Place | NavAttack (Navid Shabani Barzegar) | €7,500 | 0.2731 |
| 3rd Place | paulonium (Paul Blanc-Durand) | €5,000 | 0.2732 |
All winning solution code and reports can be found in the winners repository on GitHub. All solutions are licensed under the open-source MIT license.
Meet the winners
The Avengers
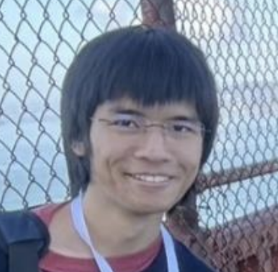

Team members: Dinh-Viet-Toan Le and Samuel Ansel
Place: 1st Place
Prize: €12,500
Hometown: Lille, France
Usernames: dvtle, SamuelAnsel
Social media: Dinh-Viet-Toan Le, Samuel Ansel
Background:
Samuel Ansel is a research engineer and data scientist at Lille University Hospital (CHU de Lille), where he uses LLMs on textual healthcare data to improve patient care. He studied machine learning at ENSICAEN and spent six years in Intelligent Document Processing before taking on his current role.
Dinh-Viet-Toan Le is a research engineer in the health data warehouse at CHU de Lille, working on natural language processing for healthcare. He trained as an aeronautical engineer at ISAE-SUPAERO with a specialization in data science, and defended a PhD in Music Information Retrieval at the University of Lille in November 2025.
Summary of approach:
We focus on the asymmetry between the left and right parts of the striatum, which represents the main geometric anomaly associated with parkinsonian syndromes according to the provided problem description and a quick literature review.
To this end, the data processing pipeline is designed to isolate the striatum through a tight crop of the scans, followed by its separation into left and right components. This data is then passed through a Siamese neural network which further captures the symmetry or asymmetry of the striatum.
If you were to continue working on this problem for the next year, what methods or techniques might you try in order to build on your work so far?
This question can be approached from two perspectives: improving our current models and exploring the new research directions that this challenge may open up.
Since incorporating synthetic data improved our model's performance, we wonder whether better quality, more diverse, and more clinically relevant synthetic data (e.g., through conditioned generation of DaT scans) could further improve generalization. Disease-related information beyond the striatum, in other anatomical regions or complementary imaging modalities, may also improve predictive performance.
This challenge also opens new research directions. The competition data capture a patient's condition at a single point in time, and since neurodegenerative diseases evolve, modeling the longitudinal evolution of scans could support clinical follow-up. In practice, brain scans are also interpreted alongside clinical reports, biological measurements, and other patient information, so a multimodal framework combining imaging with textual and structured data could provide a more complete picture of the patient's condition.
Check out The Avengers' full submission in the challenge winners repository.
Navid Shabani Barzegar
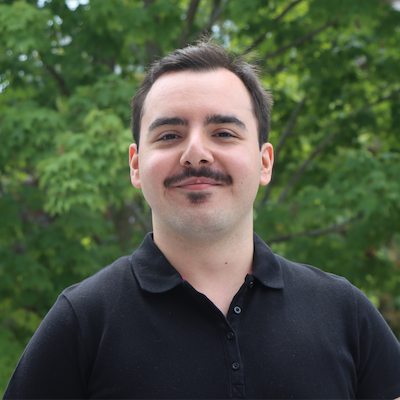
Place: 2nd Place
Prize: €7,500
Hometown: Kingston, Ontario, Canada
Username: NavAttack
Social media: /in/navid-shabani-barzegar-16036a35a
Background:
Navid Shabani Barzegar is a fourth-year Honours Health Sciences student at Queen's University in Kingston, Canada, graduating in 2027. He hopes to study medicine and build a career in neuroscience, with a particular interest in understanding how the brain computes. He built and trained this solution on his laptop over the summer.
Summary of approach:
Preprocessing made a large difference. My first submission used a percentile mask that swallowed the scatter halo on large fields of view, and fixing it raised the single-feature AUROC of the striatal specific-binding ratio (SBR) from 0.56 to 0.84. A two-peak localiser finds both striata and sets a canonical frame, from which I sample a 96 mm cube in SBR units. For the feature models I register that crop rigidly to a template built from training crops.
The ensemble combines (1) L1 logistic regressions on hand-crafted region features, (2) a 3D CNN that scores each hemisphere with a shared encoder, (3) ImageNet-pretrained EfficientNet models that read maximum-intensity projections, and (4) a TabICLv2 in-context model on selected features, acquisition descriptors, and prior scores. Members (1) to (3) enter a fixed-ratio logit stack, which beat a fitted stacker on 6 of 6 re-splits, and the final prediction blends that stack with the TabICL model.
If you were to continue working on this problem for the next year, what methods or techniques might you try in order to build on your work so far?
More scans. The learning curve still descends, and doubling the cohort should gain about 0.008-0.015 on the stack. Monte Carlo simulation is the only licence-clean source I found.
Acquisition metadata. The data carry no acquisition fields. Centre, camera, collimator, reconstruction settings, and attenuation and scatter correction would let the models separate acquisition from disease in the two hardest inferred centres, which carry 45% of CV loss.
Age, sex, and follow-up diagnosis. The data contain neither age nor sex. A later clinical diagnosis would add information that a single scan cannot give, and would help most with the 25 scans that all four pipelines misclassify.
Check out NavAttack's full submission in the challenge winners repository.
Paul Blanc-Durand
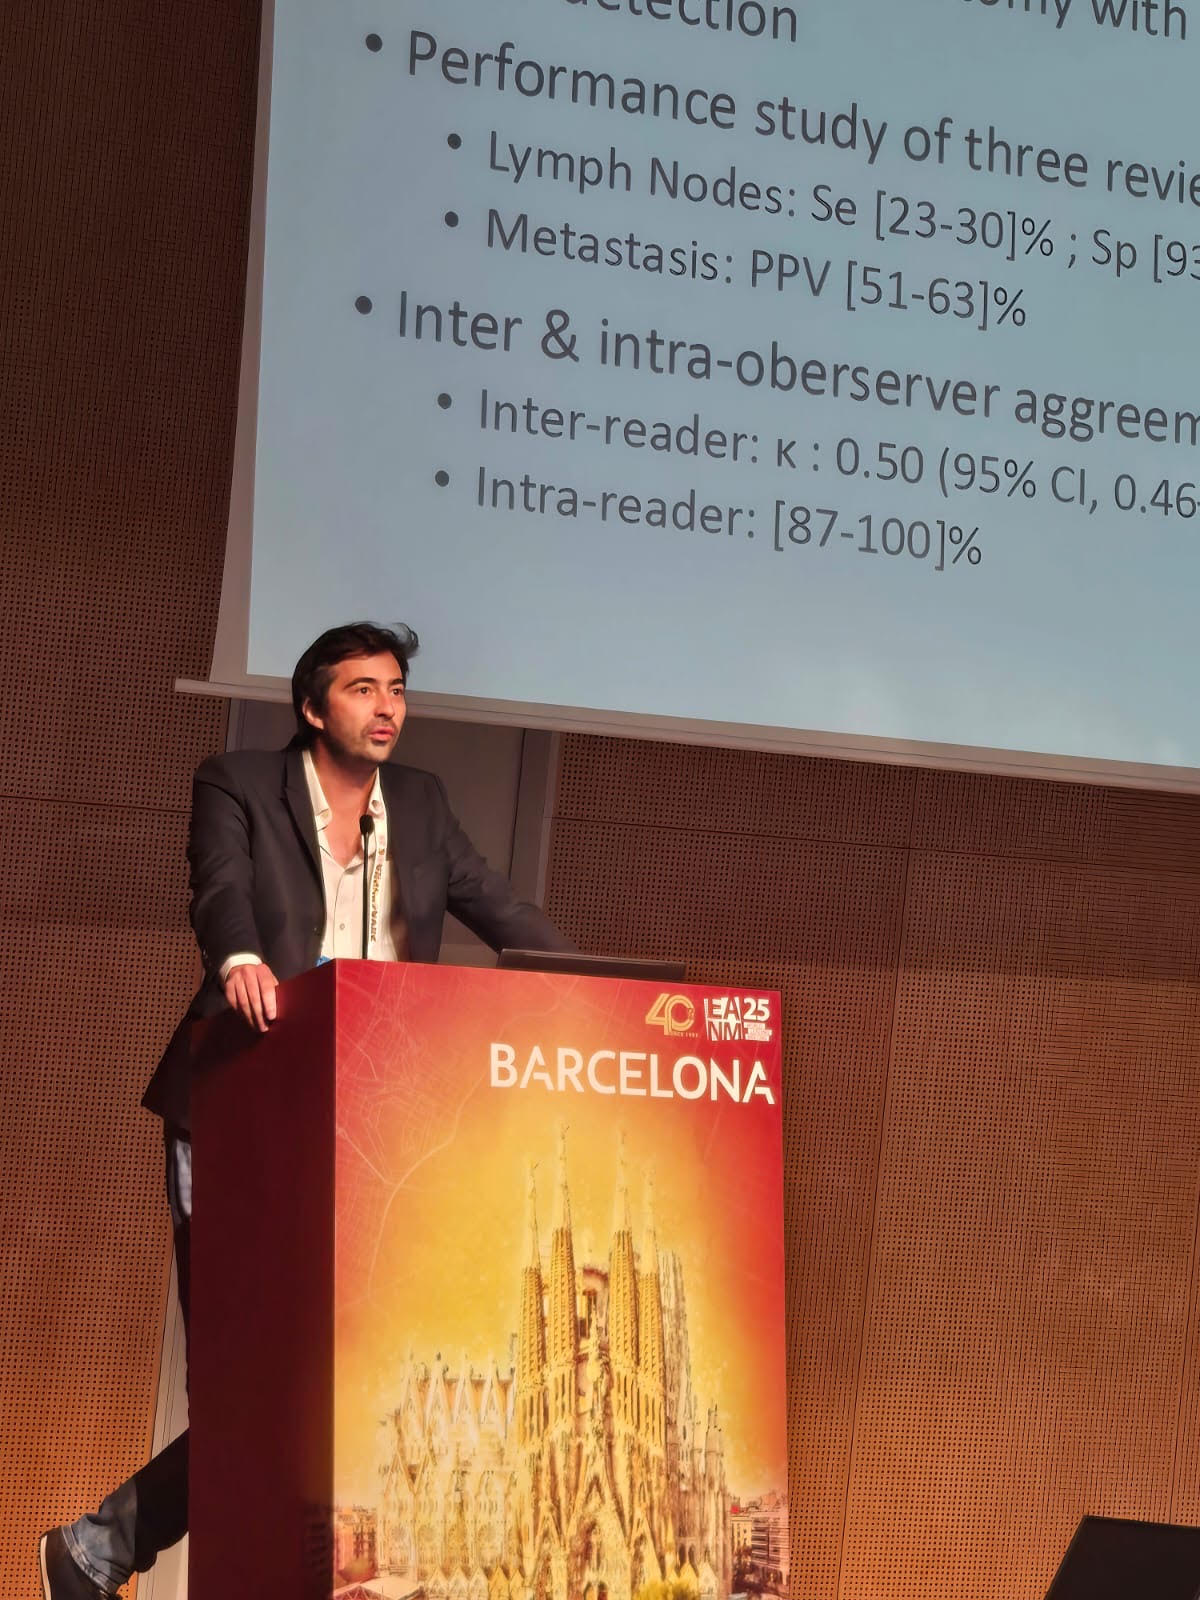
Place: 3rd Place
Prize: €5,000
Hometown: Paris, France
Username: paulonium
Background:
Paul Blanc-Durand is a nuclear medicine physician with a triple background in medical training, engineering sciences, and business. Five years ago he co-founded PAIRE, an AI-based company building an assistant for nuclear medicine physicians interpreting PET/CT. His clinical practice is split between a university hospital (CHU Henri Mondor, APHP) and private practice (CISEL Chartres, IMT Asterion).
Summary of approach:
I quickly realized that 3D convolutional neural networks were largely worse than 2D ones, so I worked on projections and tried to maximize information related to priors such as posterior striatal denervation, asymmetry, and length-shortening of the striata.
Each 3D scan is reduced to a small stack of physically meaningful 2D maps (four axial channels for peak uptake, mean uptake, anisotropy × uptake, and a normalized displacement-tail channel, plus per-hemisphere sagittal views), read by an ordinary 2D DenseNet121. This beat full-3D and striatal-crop-3D readers by a wide margin (0.043 and 0.035 log loss worse, respectively, across three seeds). Striatal scale is deliberately never normalized: length alone reaches 0.89 AUC, and normalizing it away would delete that signal. The final model is a 10-member × 5-fold ensemble with flip test-time augmentation, calibrated by a single temperature slope.
If you were to continue working on this problem for the next year, what methods or techniques might you try in order to build on your work so far?
I would add clinical data — age and sex may alter normal striatal length, and the model currently has no way to condition on that. I would also explore why some architectures that worked really well on the training set didn't transfer well, notably equivariant CNNs.
Check out paulonium's full submission in the challenge winners repository.
Thanks to all the challenge participants and to our winners! And thank you to the French Society of Nuclear Medicine (SFMN), the Health Data Hub, and GaelO for supporting and coordinating this challenge!